If you have ever spent any time walking around a cow pasture you may be familiar with three things about it that remind me of the Enterprise Asset Management (EAM) systems implementations. First, the paths the cows choose to follow are convoluted and entrenched in the history of the herd much like many EAM and the business processes they support. Secondly, there are many traps to step in along the way to a full implementation. Lastly two out of three cow pastures stink, a statistic that holds true for EAM implementations as well.
Lets explore this cow path analogy a bit more. Your organization, over time, using the past EAM or Computerized Maintenance Management System (CMMS) has created both formal and informal processes for getting a work order or work request from one place to another. These paths have dead ends and lots of wasted steps from one part of the process to another. They are not necessarily logical but they have historically gotten the results we have become accustom to. To say it simply they got us from the field to the barn and back again. The focus was on getting it done not getting it done at the level of efficiency that is required to be competitive today.
The problems comes in when many people began to implement their new EAM system and they choose just to automate the old processes without first taking a hard look at the effectiveness of those processes. This is equivalent to paving the old cow paths. They are faster to travel on but at the end of the day they are so crooked and illogical that you do not get the step change in performance you or your boss expected from the investment.
Two keys to avoiding this loss in potential performance is completing true current and target (also known as "as is and to be") process mapping where you leverage what you already do right while eliminating the dead ends, traps, and non value added activities. Leveraging what you do right will help tremendously with your change effort and your sustainability. The second thing that will help is not relying just on your EAM vendor or internal IT department for help with the best practices process part. If you do then you can expect the best practices in software use and not best practices in maintenance and reliability. Reach out to others who are doing it right in your industry and outside of it, use the many books that exist on the topic or bring in any one of the many consulting organizations that focus in this area. If you take this step you can ensure that the new processes that you put in place not only work with the software but also drive the reliability of your facility to its full potential at the lowest overall cost.
In the end, do not miss a huge opportunity to make a step change in reliability performance just because you chose or are lead down the less painful and newly paved cow paths.

Monday, September 26, 2011
Monday, September 19, 2011
Holy Metrics, Metrics Madness and Metric Insurance
As I review the metrics within many facilities I see two common trends that just don’t work for me, or them. The first is the existence of eternal metrics that have become holy to the site and have been tracked for years with little change in the value or importance. The second is the metric madness that runs rampant in many facilities. It manifest itself as 347 metrics and Key Performance Indicators (KPIs) thrown all over boards, scorecards, and reports which are then delivered to everyone under the sun.
So let us look at holy metrics first. These can get their start when someone benchmarks another site and grabs on to their metrics list or corporate pushes a list down to the facilities without fully understanding the current state of the operation. Metrics and KPIs should be based on the behavior the organization is trying to change. Now don’t misunderstand, I am in favor of a few corporate or “key” performance indicators to benchmark the business but this has to be a short list. I am also OK with having other metrics that calculate based on your data within the Computerized Maintenance Management System (CMMS) or Enterprise Asset Management Systems (EAM) and remain in the background for use in problem solving. Specifically, I am talking about the metrics you use to run the business on a regular basis. These focus metrics need to be part of a short list that is designed to do two things: improve performance and provided “metric insurance.” Metric insurance is the system of checks and balances that insures that when a metric is trending the correct direction we are getting the result we should expect. For example if a measure of reactive work is going down then we would logically expect availability of the assets to be going up. If it is not then we have a something of interest to investigate. It could possibly be a calculation issue or even a bit of metric cheating going on. We have created a list of twenty of these complementary metrics with their relationships that can be used to check results. It does not display well here but if you would like a copy send me an email and I will send it over. The key point is if your focus KPIs have not changed much in the last few months or years it may be time to remove a few from the focus list and add in a new one that can be directly linked to a business process change you are trying to make. When this metric flat lines it too should be removed and another positive behavioral changing metric should be put into its place.
If you add the new metric but you do not take the focus off of the old one you are left with metric madness as described earlier. In my ideal world, there should be no more than ten “active” metrics and KPIs in a given area. These can change by area and level as they cascade through the organization but at any one level or department they should have ten or less to focus on. I equate this to something that I experienced recently while watching college football in a large sports bar with over 40 TVs. If each TV represents a metric, then which one do you watch? Where do you put your focus? I found myself jumping from TV to TV and never really getting a good picture of what was going on in any of the games. This can be OK for college football but it does not work at all when you are trying to manage a business.
So to wrap it all up, we need to limit the number of metrics in our focus list of KPIs so we can really put the focus on them. We must make sure that most of the metrics are active and driving behavioral change in the organization not stale and flat lined. We should not forget about the use of metric insurance to verify results are accurate. If we take these guidelines in to account as we structure our metrics program then we will push to higher levels of performance instead of just measuring where we are today.
Monday, September 12, 2011
The Basics of Reliability Series: Project and Change Management
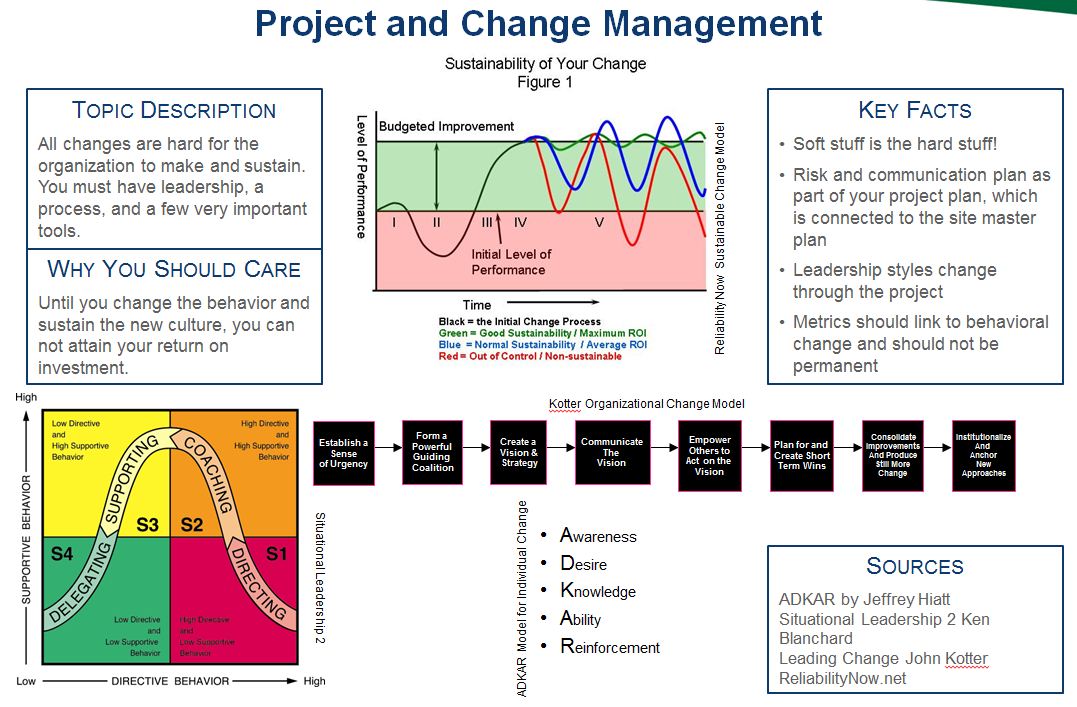
The last single point lesson in this series covers project and change management. Three models are used to make sure everyone understands that improving reliability is a “big deal” change and that it has to be treated as such. With that said they must think about individual, organizational, and leadership change in order to be have the best chance of success.
The first two models can almost be treated as checklists at their simplest level (if you dive deeper they yield much more insight). They include Kotter’s model for organizational change management and the ADKAR model for individual change from Prosci and Jeffery Hyatt. These models help us see when we need to do certain steps, why we need to do them, and what can happen if we miss or skip a step. Both models are very linear processes, which works great for those of us (engineers) who are drawn to the sequential things in life. If you follow them in order they will increase your likelihood of success by moving the effected individuals and the organization as a whole forward through the valleys of change where they become easily overwhelmed and on to the new level of performance.
The last model is the change curve, which is based off of Blanchard’s model for Situational Leadership 2. It shows that the needs of the effected parties will change as they mature through the change process. This means that as leaders, we must change as well. In the four-box graphic, you can see what these individuals will need as they progress, and the numbers in each box correspond to the areas shown with roman numerals in the Sustainability of Your Change model.
Ultimately, the real take away is not these five single point lessons; it is the understanding for why they exist. We need to communicate the reliability message multiple times from different people in different ways, and in the end, the listeners should all come to the same conclusions, which allows us to get the required results. Use these single point lessons or create your own and communicate, educate, and assimilate your way to excellence in reliability.
Monday, September 5, 2011
The Basics of Reliability Series: Problem Solving or Cause Analysis

Problem solving or root cause analysis (CA) is all about continuous improvement with a repeatable and sustainable process that drives results. There are three key points to make with the graphics contained in this Single Point Lesson (SPL) .
First of all, we have to get past the physical roots into the systemic and latent roots to get the maximized return on investment from our cause analysis efforts.
Secondly, CA without a process leads to reports and documents without results and returns on investment.
The third and final point is that simple is good, but not too simple. You do not have to always complete elaborate reports and analysis for every problem, but on the other hand, do not miss a root cause by being too simple. This balance is driven off of the dollars associated with the situation. For example, you can start with a 5 Why approach to CA (shown in blue on the CA single point lesson) and if you discover that the problem is bigger than that or the return supports more effort, then branch out from the 5 Why and create a fault tree (shown in black on the single point lesson). If you discover that you are left with multiple scenarios or questions that you cannot answer, simply take that next step and add in logic of “and” and “or”, and use the logic tree to dig deeper (shown as the addition of the purple symbols on the single point lesson). This simple process is what we call the transitional method to CA, and it allows you to take it to the level that makes sense for the problem.
This CA effort supports your quest to eliminate or mitigate equipment problems, process problems, and job plan and estimation issues as long as you follow through to implementation and verification.
Remember there is no benefit until you make a change!
Subscribe to:
Posts (Atom)